OWLS
Optical Waveguide Lightmode Spectroscopy
Manufacturer:
external pageMicroVacuum Ldt., Budapest, Hungary
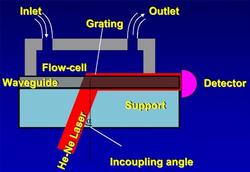
Optical Waveguide Lightmode Spectroscopy (OWLS) allows for the in situ measurement of the surface immobilization of biomolecules in aqueous environment. OWLS is based on the incoupling of a laser into a waveguide by an optical grating. This incoupling only occurs at two well defined angles. These incoupling angles are sensitive to refractive index changes within the evanescent field generated above the surface. These incoupling angles are monitored by continuously changing the incident angle of the laser and measuring the incoupled light intensity with a photodetector placed at the edge of the waveguide.
The OWLS technique measures refractive index changes of which the adsorbed mass can be calculated using de Feijter‘s formula. Since this formula only contains the difference between the refractive indices of the adsorbed layer and the cover medium so the coupled water is not visible by this technique.
Another important feature of the technique is the ability to carry out electrochemistry while simultaneously measure mass adsorption. Therefore Indium Tin Oxide (ITO) coated waveguides are used to assure electric conductivity.
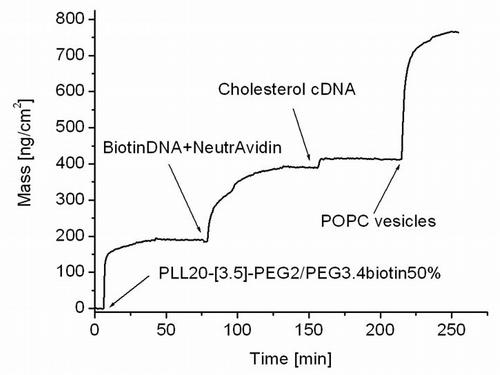
A sample curve monitored with OWLS showing the adsorption of intact vesicles via DNA is presented. (see Project Vesicle Microarrays)
Sample curve of the intact vesicle immobilization monitored using OWLS. After establishing a stable baseline in buffer solution, biotinylated PLL-g-PEG is injected and the adsorption is monitored until saturation. Then, the flow cell is rinsed with buffer solution and complexes of neutravidin and biotinylated single-stranded DNA are added. After rinsing with buffer solution, complementary DNA tagged with cholesterol are selectively hybridized to the surface. Finally, 50 nm vesicles can be adsorbed via the incorporation of the cholesterol into the membrane of the vesicles.
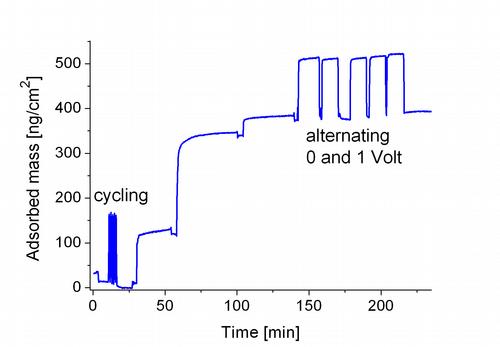
A sample curve of the combination of adsorption and electrochemistry is shown below.
A sample curve of an EC-OWLS measurement on ITO is demonstrated. To stabilize the ITO the system is cycled first. Then the desired molecules are adsorbed (in this case three steps). Finally a potential of 1 V was applied several times for 10 minutes.